
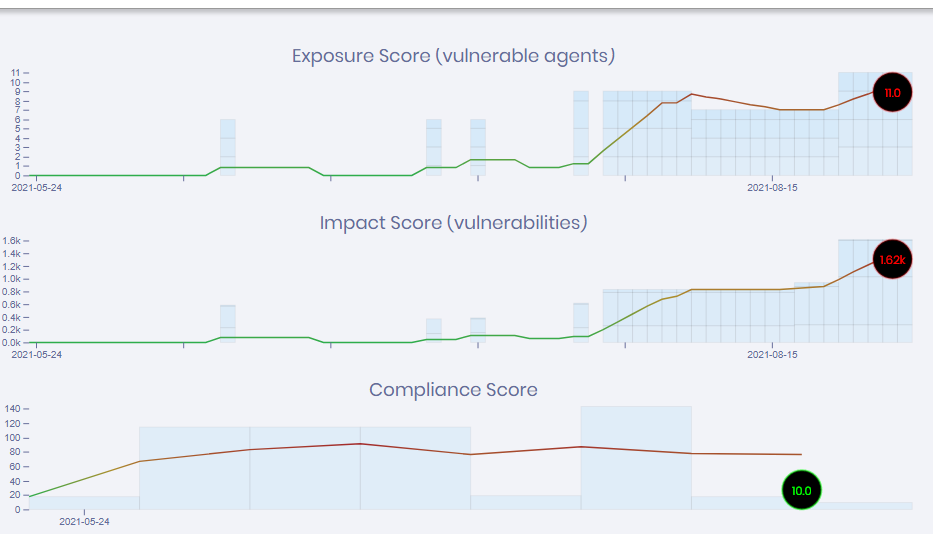
The exposure score is a count of vulnerable agents, with the circled number being the current state. The mouse-over values show the break down by severity of vulnerability for the given day.
The impact score is a count of the vulnerabilities themselves across all agents, again with severity detail on mouse-over.
Both of the above are displaying data from the NVD based scans. (If you do not see these scores on your dashboard, please verify that your NVD scans are turned on in your configuration)
The compliance score is showing the number of compliance failures across all agents. This chart's numbers are the results of the SCA based scans.
On all charts, the moving average line and the circled current value are color coded based on trend movement, with red indicating an increase in exposure.
Put more generally, the purpose of those charts is to indicate changes over time, whether your systems are becoming more or less vulnerable and the extent of the change. The numbers themselves are not a score in the sense of something compared against an external fixed point, or relative to the exposure of any other users' systems.